Shawn Fletcher of Eleanor W. Graham Middle School sends this link to another blog that Science teachers may also find interesting. Thanks Shawn.
Click here
Tuesday, January 6, 2009
Monday, January 5, 2009
Nothing To Do With Science at All
Hi again
I just thought I would share this with you because it concerns one of my daughters and as a proud father, I am duty bound to crow about it.
Abby, my youngest sings back up vocals for a blues band in the Miramichi called the Terry Whalen Band. THeir brand of blues  ranges from the deep elta stuff to the more recent Stones and Zepplin brand of blues. Anyway the cool thing is that the CD just released entitled "The Devil's Fireplace" has
  been nominated for an East Coast Music Award (Best Blues Album). I am looking forward to February when the winners will be announced.
 ranges from the deep elta stuff to the more recent Stones and Zepplin brand of blues. Anyway the cool thing is that the CD just released entitled "The Devil's Fireplace" has
  been nominated for an East Coast Music Award (Best Blues Album). I am looking forward to February when the winners will be announced.
Click here to see the list of nominees!
Ola Ola! Lets talk sample size.
Hi again folks. It's been a while but trust me I haven't been idle. Well, OK I've been in the Carribean - but I'm back now! We approached the Department of Education to once again open the survey to teachers of science (grades K through 8) in hopes of getting more responses. You will remember that this was a needs assessment survey and designed to give us information needed to make some decisions about the way science is taught within our district. Ultimately we are attempting to address poor performance on PISA and the like.
The first run of the survey yeilded some startling information on a provincial scale. However the participation rate was far less than anticipated in some districts (including our own). It was determined that perhaps this was caused by time constraints. It was also determined that if we were going to be able to make determinations on a grade or district level, the participation rate had to increase.
The survey was opened again for the last two weeks of school prior to the Christmas break. Teachers who had not yet taken part were asked to make certain they attended to it prior to the break. Sadly the additional time was not productive. The increase in sample size was negligible except for our district.
So why all the fuss over sample size?
It is a matter of distribution. We had well over 1000 responses to the survey, which is impressive. One would think that this would provide all manner of information. However when one looks at the districbution of the responses, one finds that the bulk are from K-2 teachers (arguably the busiest teachers we have). Other grade levels are not nearly as well represented. In one district, only 3 grade 7 teachers copmpleted the survey. How are we to base decisions on feedback from such a small cross-section? Certainly we cant statistically compare what is happening from district to district in grade 7 science. Likewise, any decisions made with respect to this group are destined to be wrong.
The good news is that we would appear to have a decent set of data for some districts. Certainly the news is good for those districts. They will get some relevant data to help with their own decision making. From District 16's perspective we have a good sample from our own ranks and a healthy sample from a district we are targeting as "successful" on the PISA science assessment.
We are about to begin disaggregatingt the data and will be posting our findings here.
Sunday, September 28, 2008
Survey is Complete - Stay Tuned for Analysis
The Science Needs Assessment for teachers of K - 8 science has been completed by the teachers of New Brunswick. Our plan in district 16 is to compare the province as a whole to our district. Specifically, we are interested in the results from Districts 2 and 18. These districts performed much better than we did on the 2006 PISA and if they have the answer, we want it. District 17 is also of interest in that they performed similarly to District 16.
If we can track similarities with district 17 and differences with Districts 2 and 18, perhaps we can develop strategies to move our own teachers towards improvement
This week will tell the tale. Check back for bits and pieces that we find interesting
If we can track similarities with district 17 and differences with Districts 2 and 18, perhaps we can develop strategies to move our own teachers towards improvement
This week will tell the tale. Check back for bits and pieces that we find interesting
Monday, September 22, 2008
Science Survey Released
Well on Friday Sptember 19th at 2pm, the sciecne needs assessment tool was released into the wild to every teacher of science from grades K through 8 in the province. The survey formerly known as the Platypus Precursor (see previous posts) was tweaked and rebranded as a Department of Education needs assessment.
We are very excited at the thought of haveing access to all the data. After all the point of this is to do a better job in science. Hopeflully by comapring high performing districts, we will be able to better plan our own PD to maximize our impact in the classroom.
We are very excited at the thought of haveing access to all the data. After all the point of this is to do a better job in science. Hopeflully by comapring high performing districts, we will be able to better plan our own PD to maximize our impact in the classroom.
Thursday, September 18, 2008
NOS: The Notion of a Fair Test
 What is a fair test? When we discuss science experiments with younger children, we refer to them as "fair tests". Often we pull out a set of identical balls that bounce very differently and ask the question, "How can we tell which ball bounces the highest?" Students will readily ask you to drop them and see. So when you drop one from a higher point that the other, they immediately scream, "thats not fair!" Then you drop one and throw the other down - again with the protests. Eventually you can lead the students to controlling all the "variables" that could affect the bounce in a ball and your method is designed. The discussion can even get to the point where students are designing apparatus for making sure the release is simultaneous and identical for both balls.
Once the test is fair, you need to ask, How will we know which ball bounce highest? The students will then come up with a variety of ways to measure the quality of the bounce.
NOS: Hypotheses - where do they come from?
 Where do scientists come up with their hypotheses? There is a notion out there that there is some objective process that sicentists undergo to churn out solid hypotheses. This is not entirely true. Scientists are governed by their past training, and their value systems. They are no different than you and I in this regard. A hypothesis is nothing more than an attempt to answer a question. The hyppothesis must make sense in terms of the available literature and any observations that the scientist is able to find.
Consider 2 people with different scientific backgrounds say a biologist and a chemist. If these two are faced with the same data, both may form a hypothesis. However, the chances that they will be the same is remote because the researchers' point of view is different. The validity of these hypotheses will be determined by the test(s) that will be conducted subsequently.
Consider the debate over vegetarian vs meat eating lifestyles. If I was to present a graph that indicated that meat eaters lived longer that vegans, each group would undoubtedly look at the data differently - because of their convictions. So the reasoning behind science is not always objective, but the sicentific process is such that false hypotheses tend to be discarded when tested properly. Note: Properly!
NOS-a-Palooza: Correlations and Causality
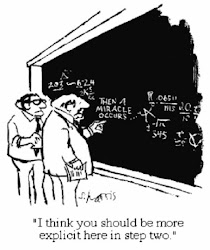
The notion of statistics is enough to send people into a cold sweat. Stats was that math class that we all had to take but that few of us enjoyed. Many are cynical when it comes to statistics. "Oh, they can proove anything with statistics." Like 'em or not stats are a necessary evil in science where we deal with averages and try to demonstrate differences. Stats help us to look at two or more average measurements and determine if in fact they are different.
One statistical element that is useful is called the corelation co-efficient (r). The correlation Coeffient is used to tell how solid a relationship is between two variables. The maximum value is 1.0 and indicates an absolute relationship.
One statistical element that is useful is called the corelation co-efficient (r). The correlation Coeffient is used to tell how solid a relationship is between two variables. The maximum value is 1.0 and indicates an absolute relationship.
 The graph to the left has a correlation coefficient of 0.9 (nearly perfect). The danger is to attach significance to this perceived relationship without using common sense. Its one thing if this was a graph of the distance travelled in a given amount of time. Clearly the farther you go, the longer it takes. This makes sense.
Wednesday, September 17, 2008
NOS - Being wrong is not only OK, it should be required
Why don't I get the answer in the book?
 What do you do when an experiment doesn't work? Well, it isn't the end of the world and it certainly isn't the end of the experiment. In Science we rarely get the answers that we expect. In fact, unexpected results often result in greater learning and understanding. The unexpected tells you: a) you were barking up the wrong tree with your hypothesis, (b) your method is flawed and needs to be revisited, or (c) you have stumbled on something previously unheard of. Regardless, you have learned something in each case. The challenge is to analyse your data and to determine which case exisits. In fact if the experiment works as planned, you have learned nothing. Your hypothesis and therefore you were correct from the outset.
 What do you do when an experiment doesn't work? Well, it isn't the end of the world and it certainly isn't the end of the experiment. In Science we rarely get the answers that we expect. In fact, unexpected results often result in greater learning and understanding. The unexpected tells you: a) you were barking up the wrong tree with your hypothesis, (b) your method is flawed and needs to be revisited, or (c) you have stumbled on something previously unheard of. Regardless, you have learned something in each case. The challenge is to analyse your data and to determine which case exisits. In fact if the experiment works as planned, you have learned nothing. Your hypothesis and therefore you were correct from the outset.
 From a classroom perspective, we are often faced with experiments based on the theory in the book. In these cases it is assumed that the students will get the right answer. In most cases the student answers will not match the textbook answers exactly. Many will be close, some not so muchand a few will be right out of the park. Keep in mind that the numbers and formulae given in textbooks are derived by professionals with access to much better equipment than is routinely available in a school lab.
Students need to know that they are bound by the same rules as mainstream scientists. The goal is to get the best answer possible under less than ideal conditions. Take for example "Physical Constants". We are told that gravity is a constant 9.8 metres per second squared. In reality this value has ben arrived through thousands upon thousands of trials. The 9.8 value is in reality an average of these trials. Atomic masses are arrived at in a similar fashion. Dont even get me started on biological systems and the genetic differences that make is necessary that all organisms behave differently in similar conditions. Therefore, it is virtually impossible to get the same answer, (let alone the answer in the text), repeatedly even under ideal circumstances with superb equipment. In fact, you should be nervous if you do.
Yet More NOS
Creativity and Imagination in Science
Although science is Empirical and appears to be very regimented, human creativity and imagination pay a very large role in doing Science. As you will see in the posts below, we cannot always see things occuring directly. In some cases observers require instrumentation to make indirect observations.
 For example, in 1913, when Niels Bohr encountered the emission spectrum from excited Hydrogen gas, he was able to actually get from the results in
  the diagram above to proposing a model for the structure of the atom (right) that resembles the view that most people recognize today. This model is still taught to Chemistry and Physics students today to lay the foundation for their understanding of the behavior of matter. Without creativity and imagination, such a leap would not be possible.
The scientific literature is littered with elegant methodologies for measuring subtle shifts in systems that cannot be seen with conventional or straightforward means. Researchers are constantly dreaming up ways to look inside black boxes without opening them. This is the realm of creativity and imagination as is molding the significance of the indirect observations into a coherent model that explains how a phenomenon functions.
More NOS
Scientific Theories vs Laws
Another aspect of the nature of science is the distinction between scientific law and theory. Within science the number of theories far outstrip the number of laws. Scientific Laws are long established and relationships that have withstood the rigors of scientific testing. Laws are accepted as truth. Simple. Boyle's Law for example describes the relationship between the pressure of a gas sample and the volume it occupies. This relationship is unwavering and since it has not been proven wrong, accepted as a fundamental truth.
Theories are not so cut and dried. Basically a theory is an idea that has evidentiary support and that can be tested. The discussion of theory vs. law is reminiscent of "Fact vs. Inference". Just as an inference can ultimately become a fact as evidence mounts in its favor, a theory can become a law if repeated attempts to disprove it have failed. Gradually, experimental evidence mounts in support of a theory or shapes a theory until it is accepted as truth (becomes a law).
 The term theory is tossed about perhaps too casually. Within the realm of Science, a theory is an idea that explains a phenomenon and is backed by evidence. By its nature a theory is not entirely correct and is subject to modification as experimentation makes it clear that adjustments need to be made that better fit our observations. For example, atomic theory has been around since Democritus coined the word "atomos" (indivisible). It was hypothesized then that matter was made of particles that could not be further broken down, no matter how much you pounded it with a rock.
Over the centuries, our view of atomic structure has changed as experimentation has shed new light.
You might ask then, that if a theory is not "correct", why bother with them? The answer is simple. Since they are based on evidence they are useful in explaining phenomena and indeed predicting its behavior under diferent circumstances. Think about it, many theories are used routinely to make decisions that affect us all. Nuclear Medicine is the result of our incomplete view of atomic structure. CAT Scans, X-Rays, computer technology, and prescription drugs are all based in theory.
Theories should perhaps be considered as "correctish" and subject to change (improvement) as more information comes to light.
Misuse of the Term
Theories above all must be testable. A researcher must be able to make a prediction about a theory and then actually test that hypothesis for its validity. If a theory cannot be tested either directly or indirectly (see post below), then it isn't a theory - merely an idea.
Hold onto something.

Evolution Theory vs Creation Theory - (the views expressed here will be unpopular with some but represent the predominant scientific view)
Evolution is a theory. On the whole it is sucessful at explaining the diversity of life and how change occurs over time. It is consistent with the archaeological record. Sure there are unanswered questions. Time and research will undoubtedly answer these.
Creation Theory is a misnomer, simply because Creation as a theory cannot be tested. Proponents will quite often cite the inconsistencies with Evolutionary theory as proof of Creation. This does not make Creation a theory, it validates Evolution's status and relelgates Creation to the realm of idea (or belief).
NOS
I thought that the best way to begin a discussion on Science was to tackle the part that most elementary and Middle School teachers have the most difficulty with. The "Nature of Science" is often lost on those without a formal Science degree and, in some cases, a B.Sc. is no guarantee that one has a grasp of the what and how of science.
 This isnt necessarily bad. There are some phenomena that can only be studied by exploiting the effect they have on their surroundings. For example, gravity is measured by measuring its effects on other things (falling bodies etc.). The atom and its structure cannot be seen even under the best microscope so we gather inferences about its structure by bombarding it with particles and watching what it does. The atoms behavior under these circumstances along with our assumptions about the nature of the particles we are using shape our view of atomic structure.
A paper by Lederman et al, (2002), in the Journal of Research in Science Teaching, the concept of NOS was broken down into several categories. I would like to explore those here. Hopefully it will serve to stir discussion among our teachers as well as to reaffirm my own knowledge.
Empirical Nature of Science
Not all Science is based on direct measurement of observable phenomena. Often, what we see as results is filtered through intricate intrummentation or apparatus. Because of our assumptions about the effectiveness of our instruments, we also make assumptions about the observations we record.
There is a subtle difference here between fact and inference. If I see it directly, then I can say with authority that it happened. As soon as I attach some significance or meaning to it, I stray from the world of fact as I apply my own personal filters to it. My background, beliefs and training, will determine how I interpret the facts I gather. Lets be honest, two researchers can look at the same data and generate completely different conclusions. And so much of Science is predicated on inference.
 This isnt necessarily bad. There are some phenomena that can only be studied by exploiting the effect they have on their surroundings. For example, gravity is measured by measuring its effects on other things (falling bodies etc.). The atom and its structure cannot be seen even under the best microscope so we gather inferences about its structure by bombarding it with particles and watching what it does. The atoms behavior under these circumstances along with our assumptions about the nature of the particles we are using shape our view of atomic structure.
Just because we cannot see something, does not mean we can study it amd make some conclusions about its nature. Finding ways to do this requires creativity and ingenuity equal to that found in any discipline.
Lederman, N.G., Fouad, A., Bell, R.L., and Schwatrz, R., 2002. The nature of science Questionnaire: Toward valid and meaningful assessment of learners' conceptions of nature of science. J Res. Sci. Teach. 39(6) p. 497 - 521.
Tuesday, September 16, 2008
Platypus Precursor
 The Platypus Precursor is the name we have given to the Needs Assessent Survey administered to all Science teachers of grades K-8 in our district. This study was undertaken in response to our relatively poor showing on the 2006 PISA. The literature is clear on what factors make for solid Science teaching. Teacher experience. training, time on task and access to resources were the most commonly cited factor contributing to sound pedagogy. Likewise, paying close attention to the attitudes and skills that make up scientific literacy was found to have far reacing effects.
The Platypus Precursor was in effect an instrument designed to determine where our teachers were with respect to these factors as well as what they saw as thier most pressing needs for improving practice. The platypus was chosen as the mascot because of the need for change in the way we do business. If ever there was a poster chamion for change and adaptation - it's the platypus. It is refered to as a precursor since the next phase will be to determine what the greatest pressures are and how we will adapt as a district Science team. The Platypus Project will lay out a strategic plan for the training and accountability of our Science teachers in the future.
The province wide survey mentioned in the previous post will hopefully give us the data we need to confirm our results, provide direction and inform our decisions as we strive to improve our practice.
Science as a Verb
Okay. I have been rummaging through tthe literature for the past few days and have come up with several tidbits of information that speak volumes. What annoys me is that very well funded research was required to come up with these gems. Really though, if you sat and thought for a moment or two, you could have come up with these points and used the grant money for a couple of weeks at your favorite all-inclusive for your whole research group.
Point one. As educators, we dont do very well at preparing our students for international tests like PISA. There could be a number of reasons for this. It could be that we dont teach as much Science. It could be that our teachers are not prepared to teach Science. Maybe, as educators we arent comfortable discussing the finer points of science with our students because our notion, of what science is, lacks. Perhaps its a combination of all these things.
In a study we recently completed, it turns out that all of the above are issues in our district. In addition to this we found other tidbits as well. All were consistent with what the literature indicates as problematic with respect to Science teaching.
Secondly, it turns out that if you want a student to become proficient at Science, you have to let him/her behave like a scientist - to model that kind of behavior. GENIUS! It seems to me that in order to do this you would have to be fairly scientifically literate yourself to promote acceptable modelling by your students.
Lastly and not surprisingly, teachers with Science training, tend to be better Science teachers. The literature is clear on this repeatedly. It only makes sense then that in Ireland, a country who performed as well as our district on PISA, 96% of their science teachers have Science degrees whereas only 8% of our teachers can make the same claim. Perhaps the correlation between a Science Degree and scientific training is weaker than one might imagine.
 Our own study, called "the Platypus Precursor" is currently underway to identify the needs of our own Science teachers and to shed light on areas that might be improved upon. We now have reams of data about our own teaching staff and we realize that we cant draw any hard conclusions from it, even though the literature is in agreement. What we need is to cast our net wider. In one week that is exactly what will take place. On September 19, our assessment tool goes out to the entire province. The brass ring here is to identify the set of parammeters that contribute to success on tests like PISA.
Just a word or two about PISA. This test is based on skills and attitudes - as it should be!. Science without skills and attitudes is a mere collecion of facts without context. If this is the case then "Science" is a noun and therefore finite. In reality, Science is dynamic and although done often (verb), it is never completed.
Subscribe to:
Posts (Atom)

_(s)_(b)%5B1%5D.JPG)