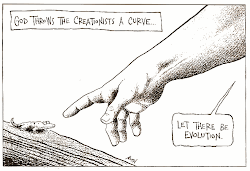
Shawn Fletcher of Eleanor W. Graham Middle School sends this link to another blog that Science teachers may also find interesting. Thanks Shawn.
Click here
Tuesday, January 6, 2009
Monday, January 5, 2009
Nothing To Do With Science at All
Hi again
I just thought I would share this with you because it concerns one of my daughters and as a proud father, I am duty bound to crow about it.
Abby, my youngest sings back up vocals for a blues band in the Miramichi called the Terry Whalen Band. THeir brand of blues  ranges from the deep elta stuff to the more recent Stones and Zepplin brand of blues. Anyway the cool thing is that the CD just released entitled "The Devil's Fireplace" has
  been nominated for an East Coast Music Award (Best Blues Album). I am looking forward to February when the winners will be announced.
 ranges from the deep elta stuff to the more recent Stones and Zepplin brand of blues. Anyway the cool thing is that the CD just released entitled "The Devil's Fireplace" has
  been nominated for an East Coast Music Award (Best Blues Album). I am looking forward to February when the winners will be announced.
Click here to see the list of nominees!
Ola Ola! Lets talk sample size.
Hi again folks. It's been a while but trust me I haven't been idle. Well, OK I've been in the Carribean - but I'm back now! We approached the Department of Education to once again open the survey to teachers of science (grades K through 8) in hopes of getting more responses. You will remember that this was a needs assessment survey and designed to give us information needed to make some decisions about the way science is taught within our district. Ultimately we are attempting to address poor performance on PISA and the like.
The first run of the survey yeilded some startling information on a provincial scale. However the participation rate was far less than anticipated in some districts (including our own). It was determined that perhaps this was caused by time constraints. It was also determined that if we were going to be able to make determinations on a grade or district level, the participation rate had to increase.
The survey was opened again for the last two weeks of school prior to the Christmas break. Teachers who had not yet taken part were asked to make certain they attended to it prior to the break. Sadly the additional time was not productive. The increase in sample size was negligible except for our district.
So why all the fuss over sample size?
It is a matter of distribution. We had well over 1000 responses to the survey, which is impressive. One would think that this would provide all manner of information. However when one looks at the districbution of the responses, one finds that the bulk are from K-2 teachers (arguably the busiest teachers we have). Other grade levels are not nearly as well represented. In one district, only 3 grade 7 teachers copmpleted the survey. How are we to base decisions on feedback from such a small cross-section? Certainly we cant statistically compare what is happening from district to district in grade 7 science. Likewise, any decisions made with respect to this group are destined to be wrong.
The good news is that we would appear to have a decent set of data for some districts. Certainly the news is good for those districts. They will get some relevant data to help with their own decision making. From District 16's perspective we have a good sample from our own ranks and a healthy sample from a district we are targeting as "successful" on the PISA science assessment.
We are about to begin disaggregatingt the data and will be posting our findings here.
Subscribe to:
Posts (Atom)

_(s)_(b)%5B1%5D.JPG)